Bellabeat Case Study
Aibamaya Alvarez
2/28/2022
Bellabeat Case Study on Kaggle
Aibamaya Alvarez
2/28/2022
Bellabeat Case Study on Kaggle

Welcome to the Bellabeat data analysis case study!
This case study analyzes smart device fitness data to help unlock new growth opportunities for the Bellabeat company. The insights discovered will help guide a marketing strategy for the company.
Bellabeat is a high-tech company that manufactures health-focused smart products including, the Bellabeat app, Leaf, Time, and Spring. Collecting data on activity, sleep, stress, and reproductive health has allowed Bellabeat to empower women with knowledge about their health and habits. Bellabeat also offers a subscription-based membership program for users, giving them access to personalized guidance on having a healthy lifestyle. All of this has positioned itself as a tech-driven wellness company for women.
Analyze smart device usage of an existing competitor to identify how consumers use non-Bellabeat devices. Then identify potential opportunities for growth and recommendations for the Bellabeat marketing strategy improvement based on the insights of that analysis.
The data for this analysis is the Fitbit Fitness Tracker Data stored on Kaggle and made available by Mobius. This dataset is under CC0: Public Domain license meaning the creator has waived his right to the work under copyright law
This data set contains a personal fitness tracker from thirty fitbit users. It includes information about daily activity, steps, and heart rate that can be used to explore users’ habits. It was generated via a survey through Amazon Mechanical Turk between 12.03.2016 and 12.05.2016. Thirty eligible Fitbit users consented to submit their tracker data, including minute-level output for physical activity, heart rate, and sleep monitoring. Variation between output represents different Fitbit trackers and individual tracking behaviors/preferences.
R Studio was used to complete this analysis because it has many excellent data processing and visualization features.
install.packages("tidyverse")
install.packages("skimr")
install.packages("lubridate")
install.packages("scales")
library(tidyverse)
library(skimr)
library(lubridate)
library(scales)
setwd("/cloud/project/bellabeat/dataset/Fitabase Data 4.12.16-5.12.16/")
dailyActivity <- read_csv("dailyActivity_merged.csv")
heartrate_seconds <- read_csv("heartrate_seconds_merged.csv")
sleepDay <- read_csv("sleepDay_merged.csv")
weightLogInfo <- read_csv("weightLogInfo_merged.csv")
hourlyIntensities <- read_csv("hourlyIntensities_merged.csv")
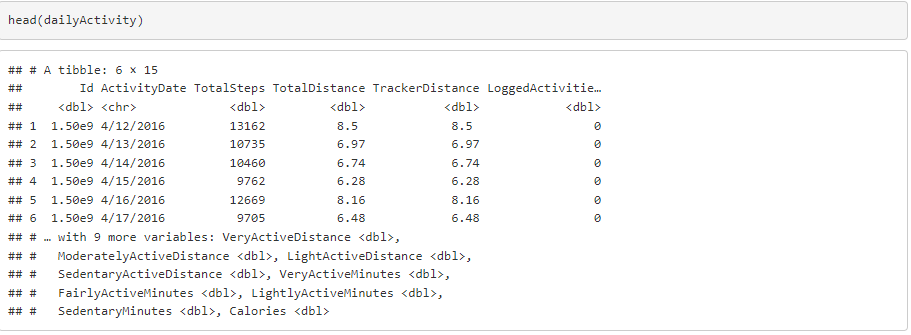
Visualize the data frame to start exploring the data and ensure they were imported correctly, with the functions head(), glimpse(), and skim_without_charts().
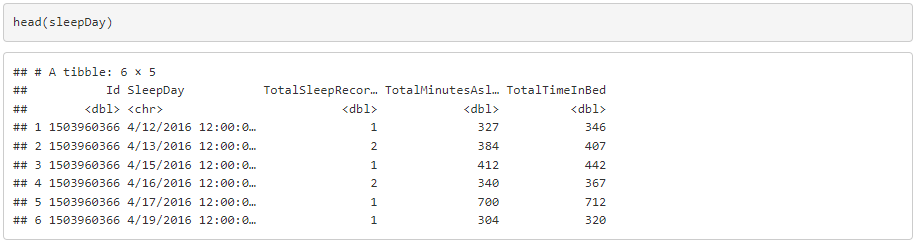
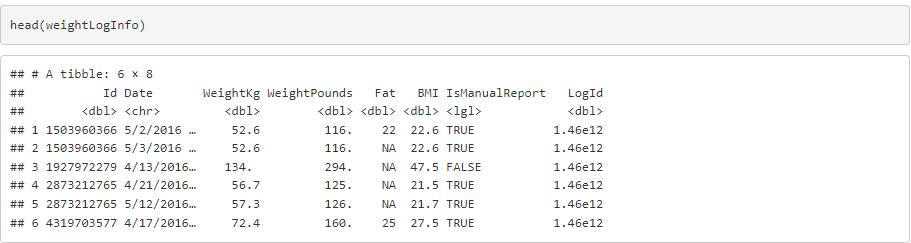
Here are tibbles from each data frame generated with the head() command.
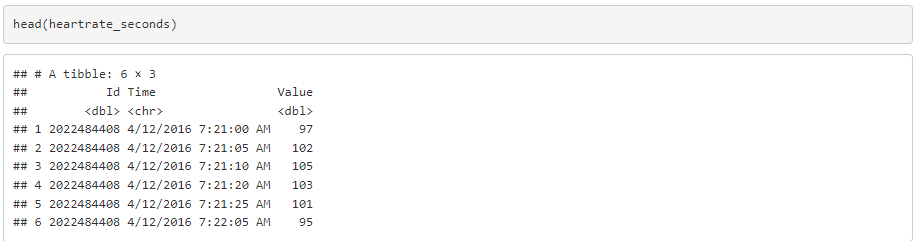
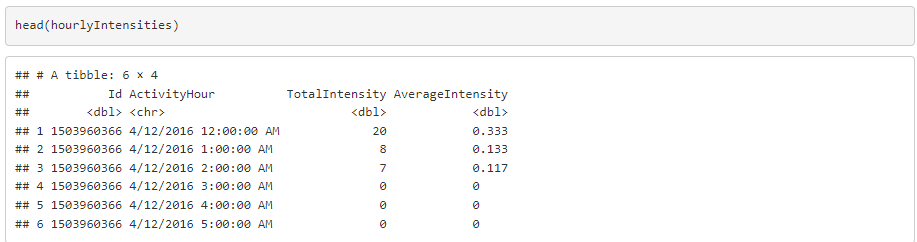
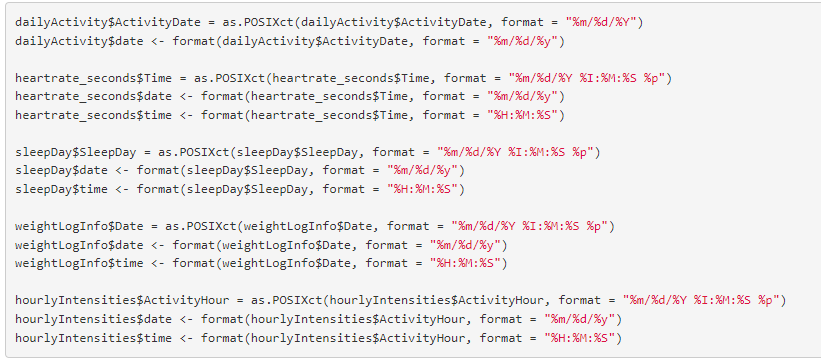
The timestamp data has an incorrect format. It is necessary to convert them to date/time format and split them into date and time variables.
Counting how many different values are in the Id variable to determine how many participants are in each data frame.
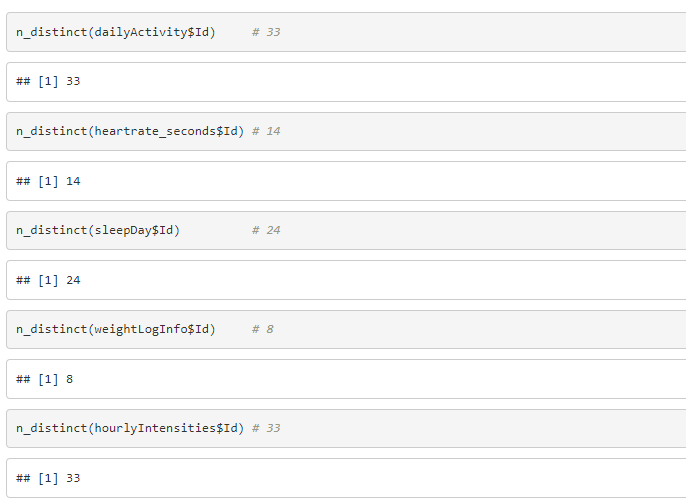
In heartrate_seconds = 14 and weightLogInfo = 8, there are too few participants to consider analyzing these two data frames.
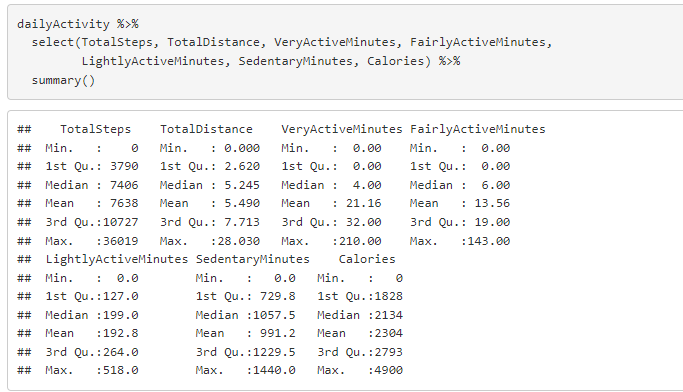
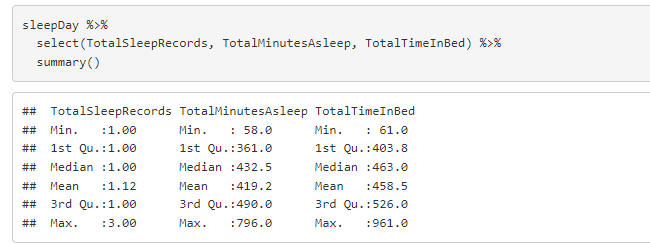
Determine min, max, and average values for the variables of dailyActivity and sleepDay data frame.
Comparison between average Fairly Active, Lightly Active, Sedentary, and Very Active Hours.
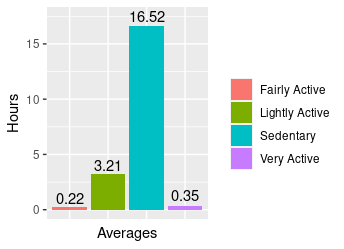
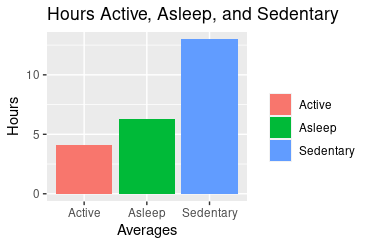
The dataset reveals that people spend most of their day sedentary with an average of 16 hours per day. On the other hand, they spend just around 4 hours active, which most of those active hours being lightly active.
Total Steps, Total Distance, Active Minutes, and Sedentary Minutes vs. Calories.
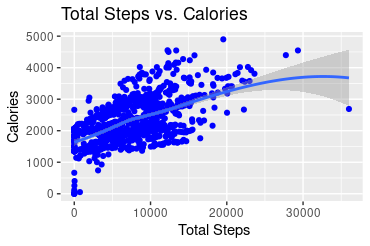
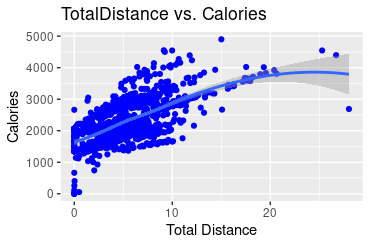
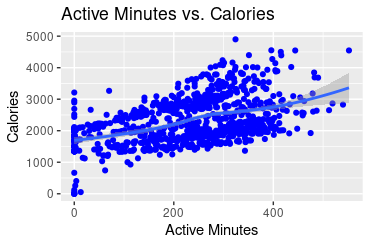
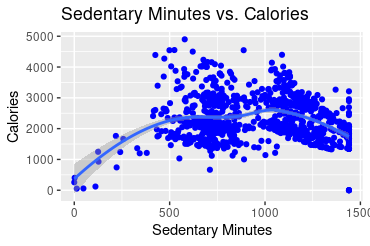
The above charts show that a person with higher active minutes tends to burn more calories in a day. The more time they spend inactive, the lower calories they are likely to burn. There is also a positive correlation between Total Steps, Total Distance, and Calories, which is clear, the more active people are, the more calories they burn.
Average Total Steps and Total Distance per Day of the Week
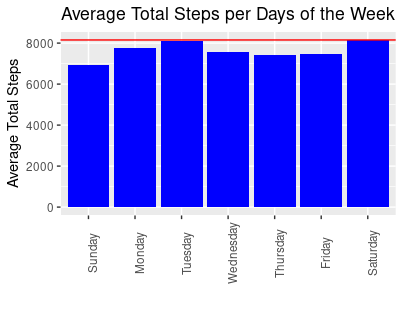
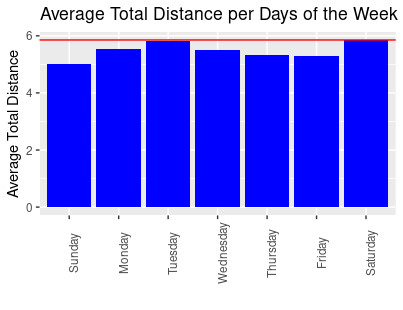
People are likely to take more steps or walk long distances on Saturday and Tuesday. In opposite, Sunday is the day when they do this less.
Average Active and Sedentary Minutes per Day of the Week
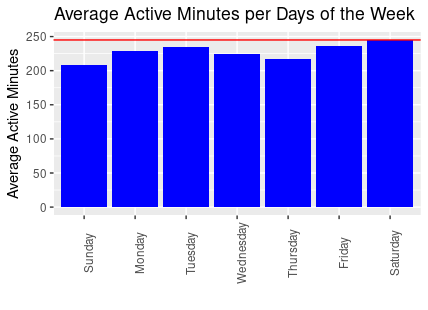
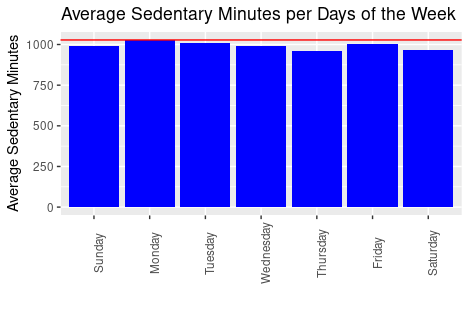
People are more active on Saturday and Tuesday, and they are less active on Sunday. The average sedentary minutes are almost equal for all of the week, with Saturday and Thursday being the days with less sedentary time.
Average Calories per Day of the Week
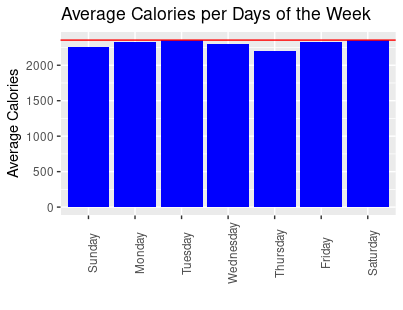
In addition to the above charts, the average calories burned per day of the week are all almost the same, outstanding Thursday and Sunday.
Time in Bed and Time Asleep
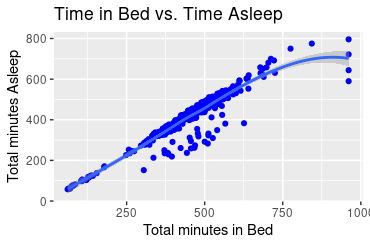
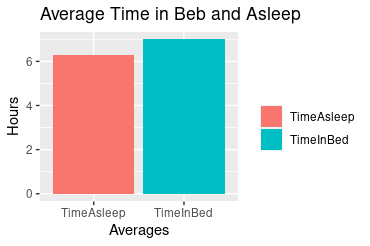
There is a positive relationship between the minutes a person stays in bed and the minutes they sleep. The average amount of time seems to be very close, within a range of six to seven hours for both. That led to the conclusion that most of the time people are in bed; they are sleeping.
Average Asleep Hours per Day of the Week
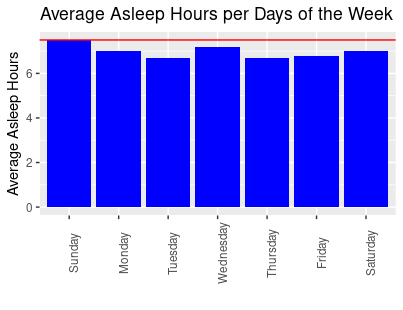
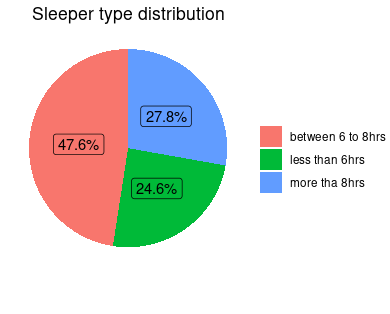
During the week, people tend to sleep more hours on Sunday, and they sleep less the rest of the days. Approximately 50% of people have a good amount of sleep, between 6 and 8 hours. On average, almost 28% sleep more than 8 hours and 24% less than 6 hours.
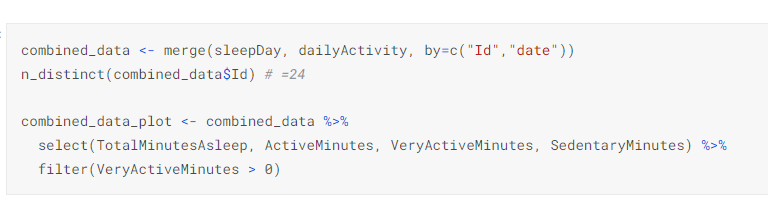
Comparison between Hours Sedentary, Active, and Asleep
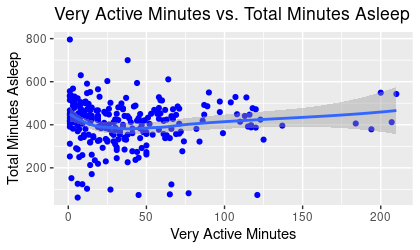
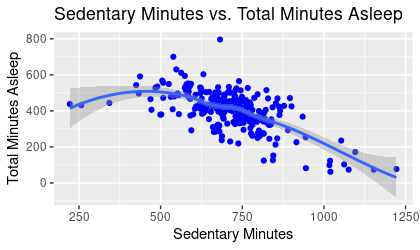
These visualizations compare very active minutes and non-active minutes versus minutes asleep. The more time a person spends non-active, the lower the time they are sleeping. It is a negative relationship that implies non-activity negatively impacts sleep time. On the other hand, there is a more linear relationship between very active minutes and hours of sleep, tending to a more positive relationship as the time the person spends active increases. It seems to be when a person is more active, his sleep quality increases.
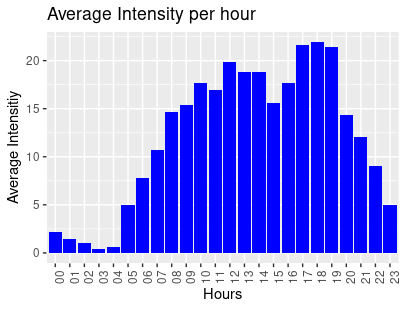
Average Intensity per Day of the Week and Hour
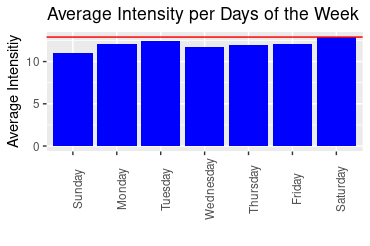
The days with more activity during the week are Saturday and Tuesday, Sunday, on the contrary, is the day less active.
Throughout the day, people are more active between 6 to 22 hours, and peak activity happens between 17 to 19 hours. From 23 to 5 the activity decreases probably because at that time people are sleeping.
After analyzing FitBit Fitness Tracker Data is possible to use these insights to help influence Bellabeat marketing strategy.
Thank you for your interest in my case study project, hope you have enjoyed it!