Welcome to the Cyclistic bike-share analysis case study!
This case study analyzes how the two groups of users (members and casual) of Cyclistic use the company services to design a marketing campaign whose goal is to convert casual riders to become annual members.
About the Company
Cyclistic, a bike-share company in Chicago, 2016, launched a successful bike-share offering. The program has grown to a fleet of 5,824 bicycles tracked and locked into a network of 692 stations across Chicago. The bikes can be unlocked from one station and returned to any other station in the system anytime. Cyclistic’s marketing strategy built general awareness and appealed to broad consumer segments. One approach that helped make these things possible was the flexibility of its pricing plans: single-ride passes, full-day passes, and annual memberships. Customers who purchase single-ride or full-day passes are referred to as casual riders. Customers who purchase annual memberships are Cyclistic members.
Characters:
- Cyclistic: A bike-share program that features more than 5,800 bicycles and 600 docking stations. Cyclistic sets itself apart by also offering reclining bikes, hand tricycles, and cargo bikes, making bike-share more inclusive to people with disabilities and riders who cannot use standard two-wheeled bikes. Most riders opt for traditional bikes; about 8% of riders use assistive options. Cyclistic users are more likely to ride for leisure, but about 30% use them to commute to work each day.
- Lily Moreno: The marketing director responsible for developing campaigns and initiatives to promote the bike-share program.
- Cyclistic marketing analytics team: A team of data analysts responsible for collecting, analyzing, and reporting data that helps guide Cyclistic marketing strategy.
- Cyclistic executive team: The notoriously detail-oriented executive team will decide whether to approve the recommended marketing program.
Business Task
Design marketing strategies aimed at converting casual riders into annual members. However, the marketing analyst team needs to understand better how annual members and casual riders differ, why casual riders would buy a membership, and how digital media would affect their marketing tactics. Moreno and her team are interested in analyzing the Cyclistic historical bike trip data to identify trends.
Questions for the Analysis:
- How do annual members and casual riders use Cyclistic bikes differently?
- Why would casual riders buy Cyclistic annual memberships?
- How can Cyclistic use digital media to influence casual riders to become members?
Data Selection
The data for this analysis is historical trip data of Cyclistic, which has been made available by Motivate International Inc. (Located on the cloud storage Amazon Web Services of the company) under this license. That is public data that can be used to explore how different customer types are using Cyclists bikes. But note that data-privacy issues prohibit using personally identifiable information of the riders. That means that we will not be able to connect past purchases to credit card numbers to determine if casual riders live in the Cyclistic service area or if they have purchased multiple single passes.
Data Organization and Description:
The dataset shows 12 months (from January to December 2021) of Cyclistic trip data. Each table consists of one-month data with 13 columns with various records like:
- ride id
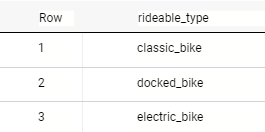
- rideable type (classic, electric, or docked bike)
- started/ended at (fields with the timestamp data for each ride)
- start/end station name and id
- start/end station latitude and longitude
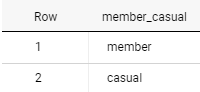
- member casual (casual: customers with single-ride passes and full-day passes, member: customers with annual memberships)
Limitations of this Data
As riders’ personally identifiable information is hidden, thus will not be able to connect passes purchases to credit card numbers to determine if casual riders live in the Cyclistic service area or have purchased multiple passes.
Environment
Tools selected for data verification and cleaning:
Tools selected for data summarization and visualization:
Data Cleaning
Inspecting the Data with Excel
The first step, inspect the dataset with an Excel Worksheet to:
- Check if every column has the correct data type.
- Check for invalid / incorrect / unusable data.
- Check if there are duplicates in the data.
By verifying the data, some problems got spotted.
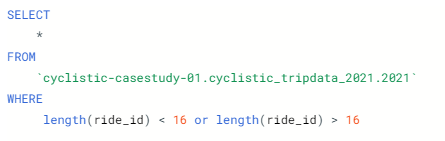
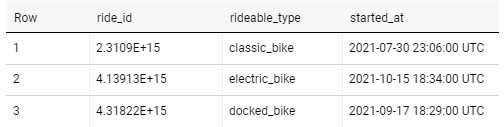
- By filtering the ride_id field, we see that most ride_id elements contain 16 characters, but some elements don't meet that condition. So, we calculate the length of the string and then filter to see what elements are different from the 16 characters.
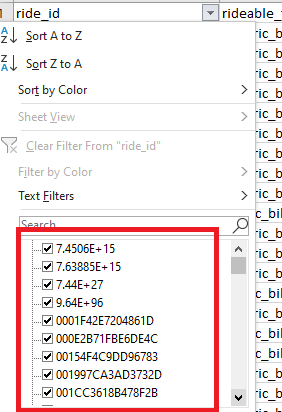
SAMPLE OF VALUES OF RIDE_ID FIELD
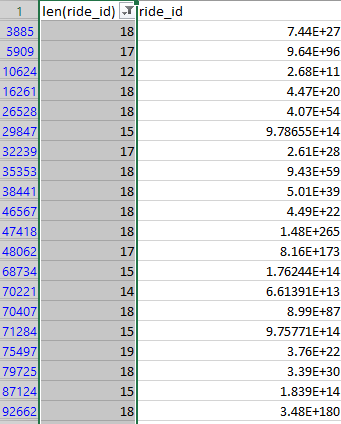
VALUES WITH RIDE_ID LENGTH DIFFERENT FROM 16 CHARACTERS
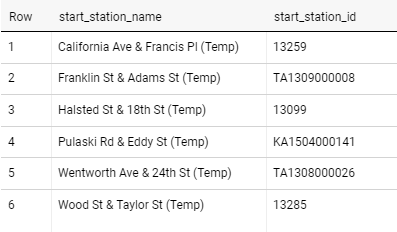
- Some cells from the start_station_name and end_station_name columns contain the string "(Temp)" at the end of the name. The string "(Temp)" needs to be removed from the station name to have a cleaner stations name.
- There are also trips with start/ end _id identified like (LBS-WH-TEST) those are rides for maintenance or repair and must be removed to avoid bias in the analysis.
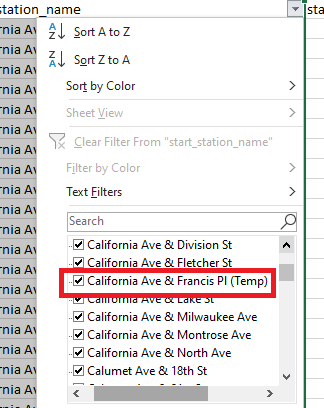
SAMPLE OF VALUES OF START_STATION_NAME FIELD
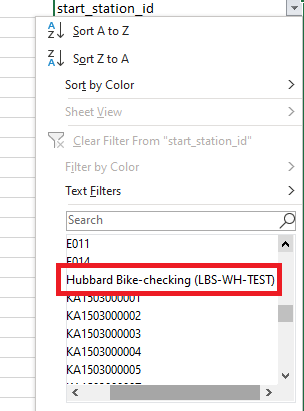
SAMPLE OF VALUES OF START_STATION_ID FIELD
Data Cleaning with BigQuery
All tables are uploaded to BigQuery to unite them in a single table for the analysis of the whole year.
We fixed the problems spotted from the inspection in excel in the new table. Also, we create two columns with new information.
- Create a table named 2021 to join all month's data.
- Create ride_length_minutes column (ride_length_minutes = ended_at - started_at) to calculate the duration of the trips.
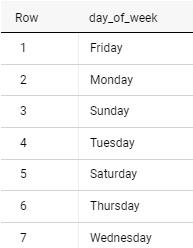
- Create a column named day_of_week (from started_at) to know which day of the week each trip was made.
- Remove leading and trailing spaces from the start/end_station_name and member_casual columns.
We stored the result of this query as a new table named 2021.

Inspecting Table 2021
Create a New Table with the Final Clean Data for the Analysis
- Generate a new table with the data cleaned
- Trim the (Temp) value from the end of the start and end station name
- Remove the trips for maintenance or repair
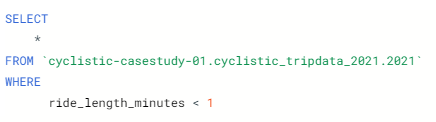
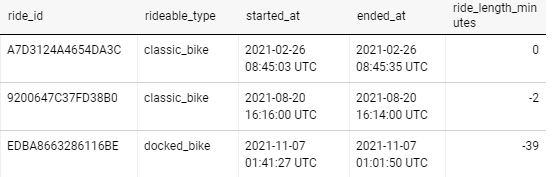
- Remove the ride_length_minutes values equal to or less than zero
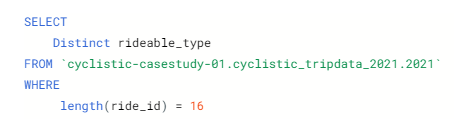
- Remove the rows with ride id lengths different from 16 characters
- We stored the result of this query in a new table named 2021_clean, which will use to perform the analysis

Visualization and Summarization
We will now perform a descriptive analysis of the data to find patterns between casual customers and members.
Analyzing how many trips took each group
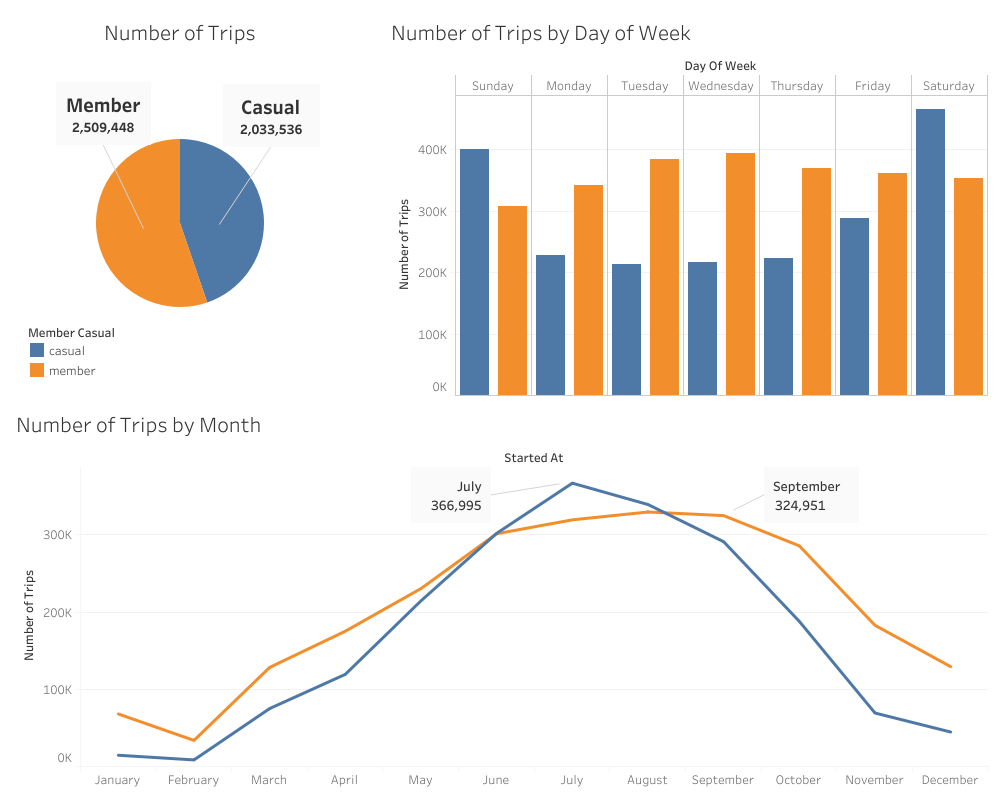
- There are more trips from members than from casuals. Members made approximately 55% of the trips.
- The most significant number of trips for members are from April to November, with a peak from June to October.
- The curve for casuals is narrower. Trips start rising from May to October, and the peak season is from June to September getting a significant rise in July with the highest number of trips of the year.
- The period with fewer trips is from December to February for both cases.
- The rise of the trips is probably related to the stations (the highest values are in summer and the downfall in winter).
- Looking at the number of rides per week, we see a difference between how members and casuals use the bike-share service.
- The peak trips for casuals occur on weekends; trips begin to rise from Friday to Sunday, reaching the highest values on Saturday, and drop during the weekdays.
- With members, the opposite happens trips go up during the week and go down a little on weekends.
- However, the number of trips varies less between each day for members than for casuals.
This graph gives us an idea of what purpose each type of customer uses the Cyclistic services; it is possible that members use the service to get to work, and casuals use it mainly for leisure.
Analyzing the average duration of the trips
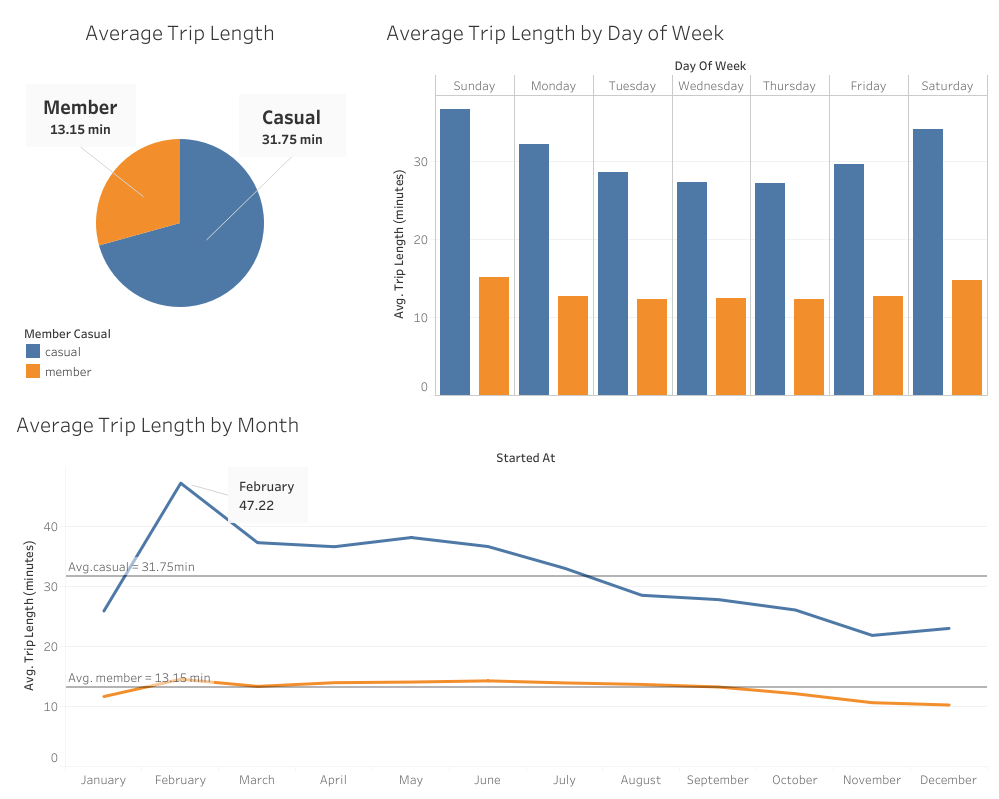
- The average duration of the trips for members is approximately 13 min, while form casuals are half an hour. On average, casuals took trips longer than members.
- The average trip duration by day of the week is similar for both users. The trips are longer on weekends than on weekdays, being Sunday the day of the week with the most extensive rides. The average duration of the trips varies more for casual than for members.
- The average trip duration is almost the same for members throughout the year. However, it falls a bit from October to January, which may be related to the winter. For casuals, the average trip duration varies more each month. For example, trips take more than half an hour between February and July and begin to decrease from there.
- The peak average duration for the trips is in February for both types, although this difference highlights more on casual, where the average trip duration goes to almost 50 minutes.
Traffic Map
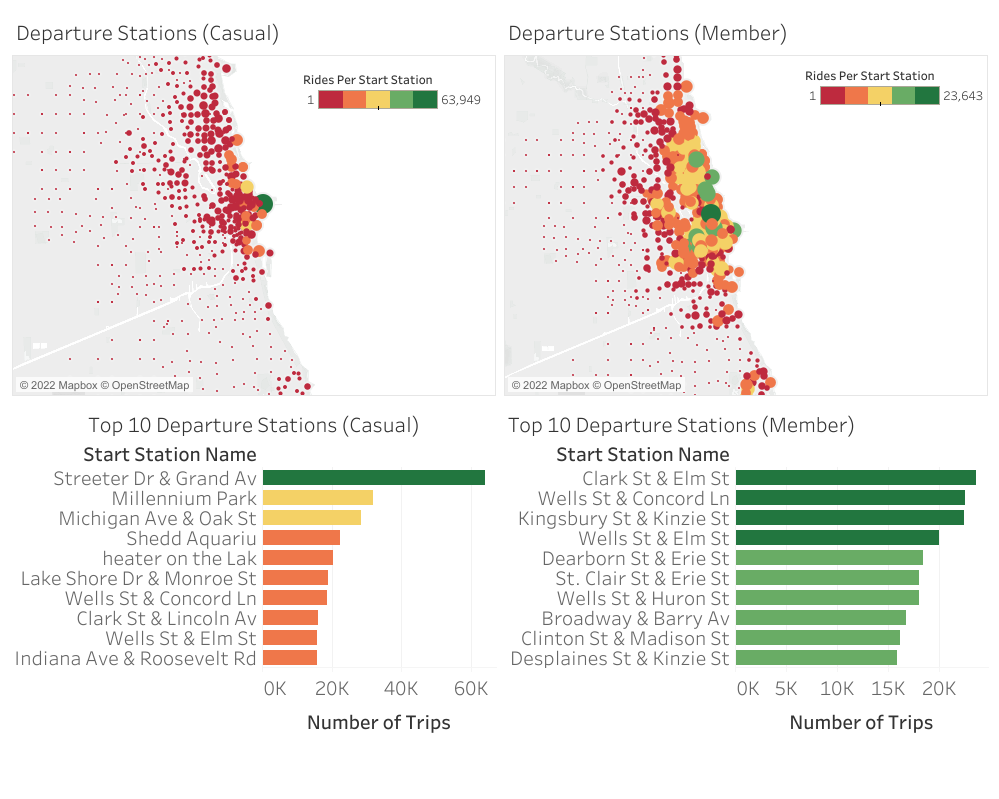
- For casuals, the stations with more trips are around the bay area, and there is one station (Streeter Dr & Grand Av) with the most departures. The further we go from the bay trips decrease a lot. Also, there is a significant variation in the number of trips departing from each station.
- Members are more spread out through Chicago, they use more stations, and the difference between the number of departures from each station is narrower.
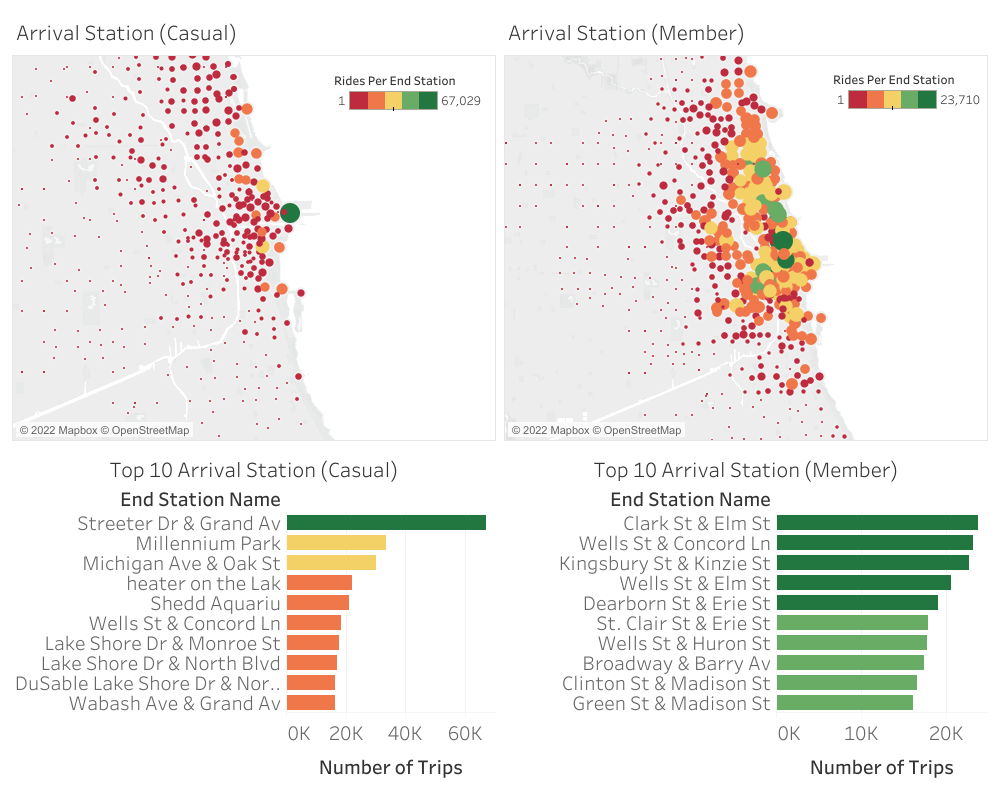
- For arrival stations, the same thing happens as for departure stations. Casual users are more concentrated in the bay area while members are spread out over a larger area.
These traffic maps help us to form the hypothesis that casual riders use these services mainly for leisure and for members to commute.
Conclusions
- More rides are coming from members than casual, although this difference is approximately 5%.
- Both groups use the bike-share service more d during the summer.
- In July is the peak use of the service, and the casual users are the ones that use it more.
- Casuals use the bikes more on weekends while members use them more on weekdays.
- Casuals take longer trips than members.
- Trips are longer for casuals between spring and part of the summer.
- Also, trips are longer on weekends for both groups.
- Most casual users' trips are concentrated near the Bay Area. For members, these trips are spread out through a wider area.
Recommendations
There are more rides from members than from casuals, indicating that the company's loyalty level is good. For that reason, there is a chance to convert casual users to members.
It looks like casual groups use this service more for leisure; they may be tourists or townies who want to take a trip for distraction, but some casuals use the bike-sharing service regularly. Those are the ones who need to point to a marketing campaign.
- Summer is a great time to launch a marketing campaign because it is the time of the year when more trips happen.
- The bay area is where casuals take most trips, which is a great area to attract customers to change their subscriptions.
- Casual groups use the bike-sharing service more on weekends; the company could consider this to offer a flexible membership for weekends only with lower prices.
- As causal groups use the service for more time (took longer trips), the company could consider this for offering any bonus or discount for longer trips.
Thank you for your interest in my case study project, hope you have enjoyed it!